Feature Visualization
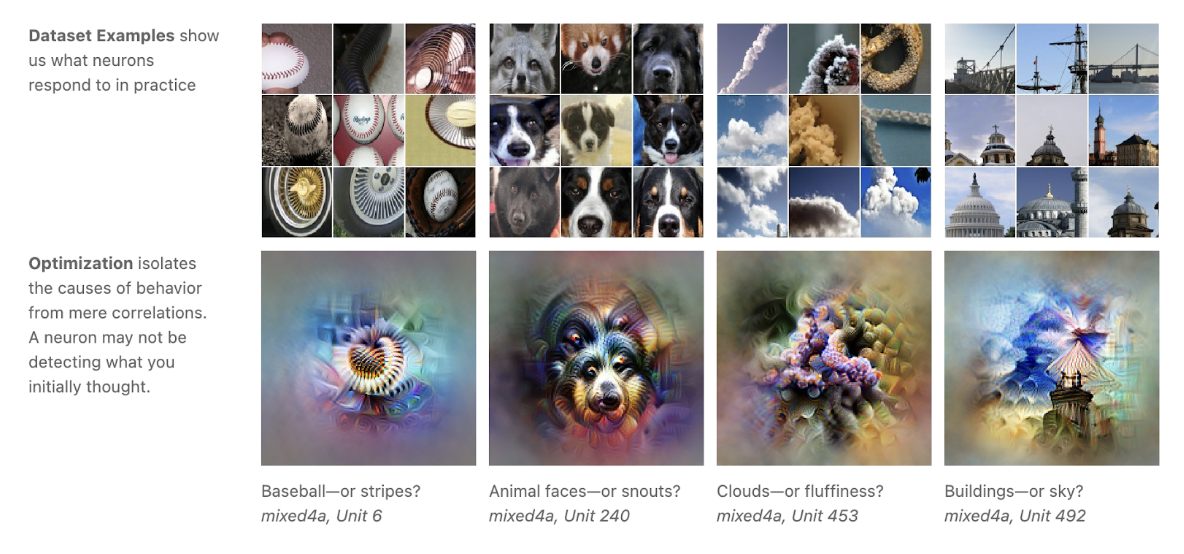
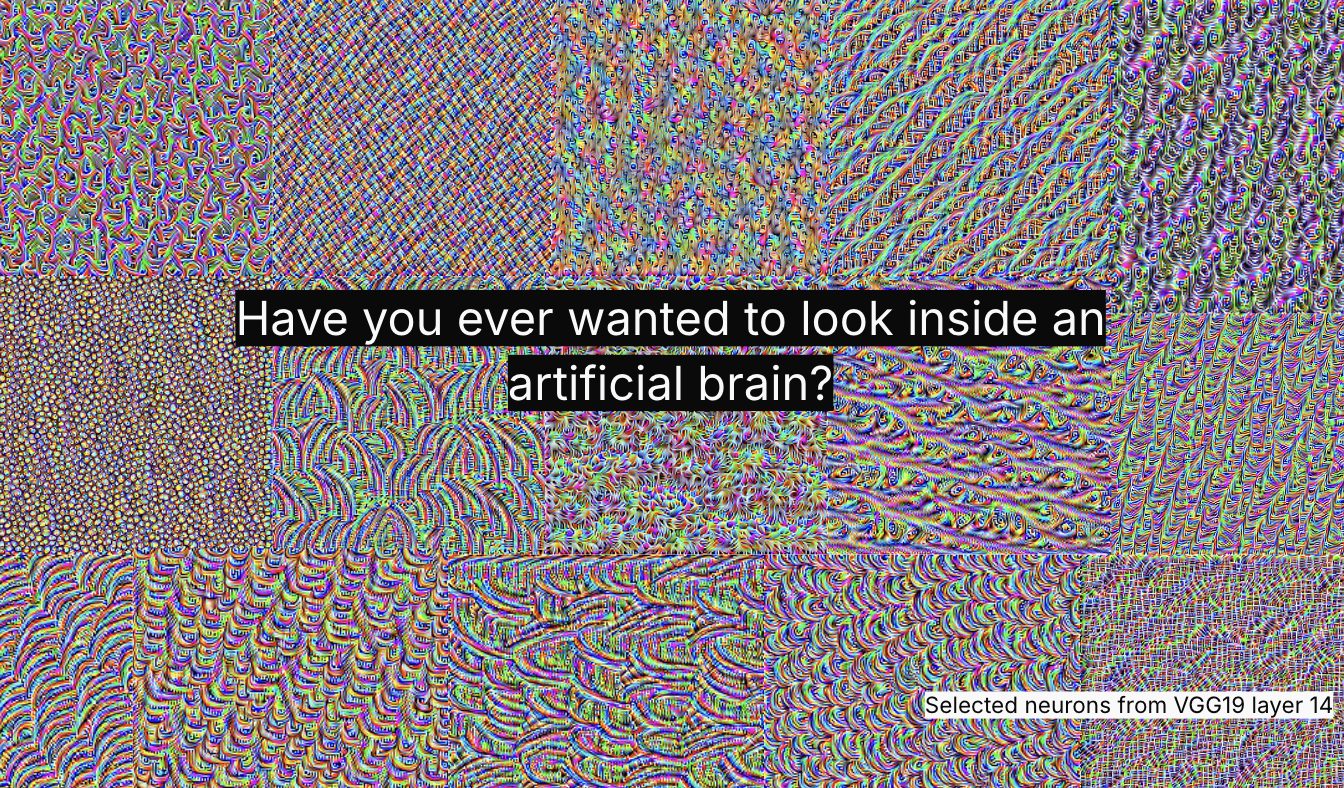
Feature visualization makes learned internal features visible. Early image-model layers often produce edges and colors. Later layers may produce textures, object parts, or scenes.
The visualizations are compelling because they give us a rare look inside the model. They are also partial.
Build a Feature Visualization, Step by Step
Optimization-based visualization doesn't search a dataset. It manufactures an image from nothing by looping forward pass, loss, and backprop. Step through the loop below.
Step 1 — Start from noise
Initialize the input as a random image — every pixel drawn independently. There is no structure yet, only static.
This image is the only thing that will ever change. The network's weights are never touched.
Loss
—
Gradient flow
idle
random noise
Gradients normally flow back to update weights. Here the weights are fixed and the image is the only thing allowed to change — the same backpropagation machinery, redirected at the input.
The optimized pattern on its own is a hypothesis, not proof. Dataset-based visualization checks it against reality: retrieve real inputs that already activate the feature and see whether they agree with what the loop produced.
Use feature visualization to generate hypotheses about what a layer represents. Then test those hypotheses on real inputs, near misses, and interventions. A wall of interesting images does not explain how features interact or whether the model uses them for the final decision.
What would you do after labeling a feature visualization “dog face”?