Visualizing Attention
Attention weights describe how one token mixes information from other tokens inside a particular head and layer. Tools such as BertViz turn those weights into lines, matrices, and heatmaps.
The visualization is useful for understanding architecture and information flow.
A normalized attention row
For query and key :
The dot product measures compatibility, scaling controls magnitude, and softmax creates nonnegative weights that sum to one.
Read One Row of an Attention Matrix
Choose a query token. Its row lights up across all key tokens, and the weighted-value summary updates below.
context(Tater) = Σ attention(0.06, 0.18, 0.34, 0.08, 0.34) × value vectors
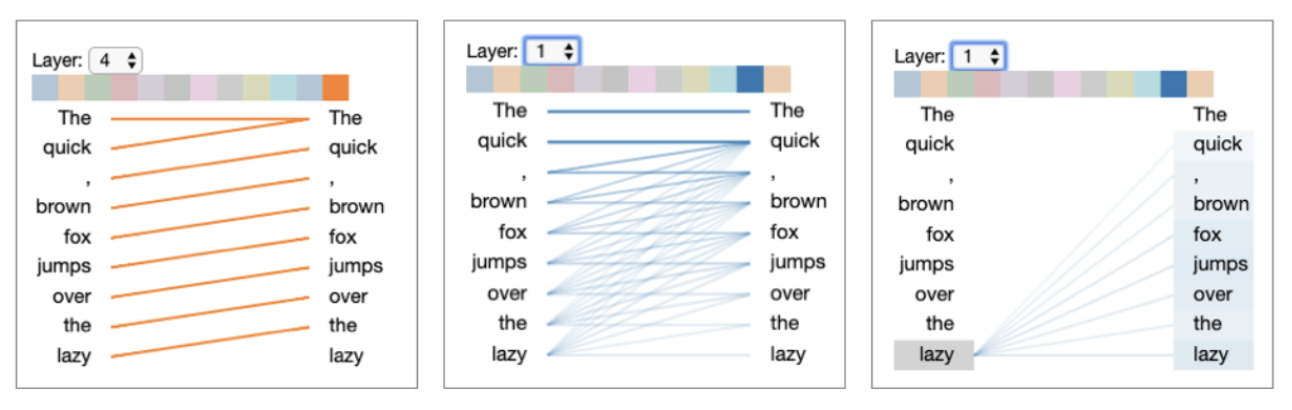
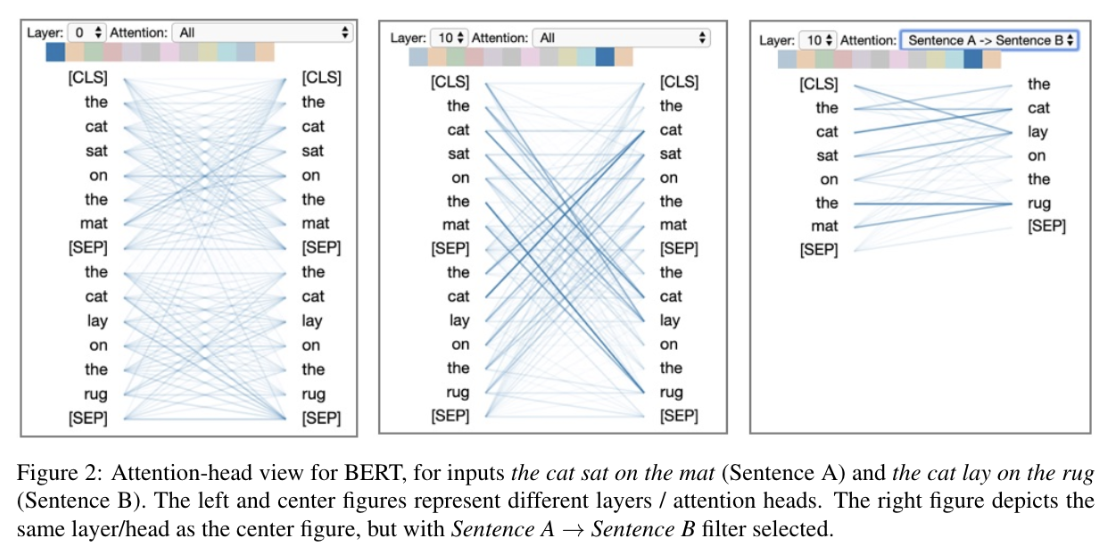
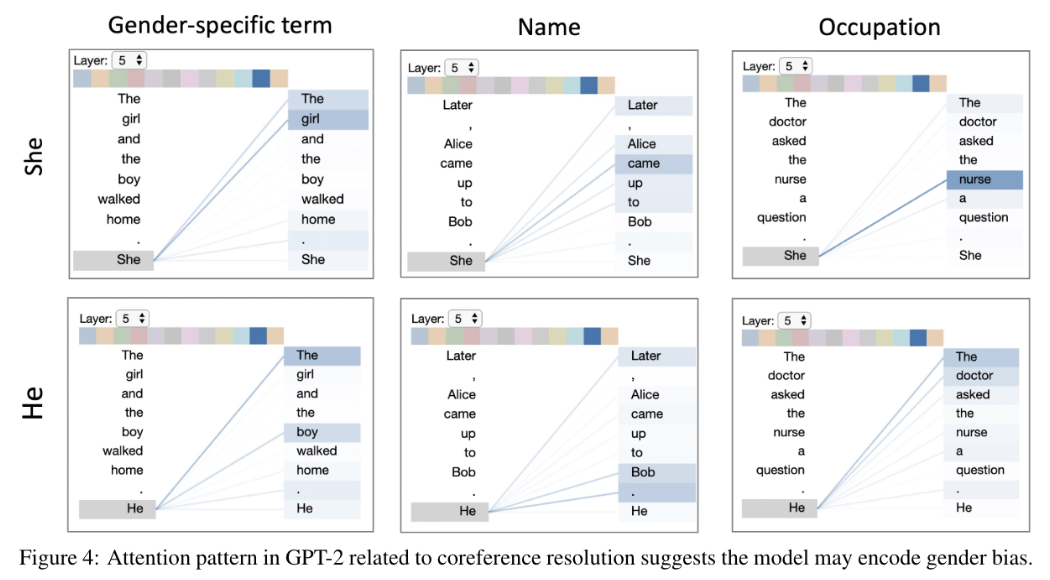
Always name the layer, head, query token, and aggregation method. Averaging across heads can erase specialized behavior, while selecting one striking head can exaggerate it.
Use attention visualization to inspect routing, then bring in causal or attribution evidence for prediction claims.
Why is an attention heatmap incomplete without a layer and head label?